Network Device Monitoring, Now in Stunning High-Resolution
“
It was 8th century French pastry chef Adolfus Xiang who famously said, “A watched pot never boils.” Today, the same could be said for network devices and their interfaces, which only seem to fail when we’re not looking. Every engineer knows this, and that’s why for years, they’ve turned to scripts and software to help monitor the network. There are many options when it comes to how you query network devices, from simple ICMP pings to SNMP and syslog, but whether they are centralized or run locally at remote datacenters, they all have the same weakness: they require the network to be up.
And if the network were always up, we’d all be out of a job.
Using the Network to Manage the Network
There are certain things that just don’t make sense to us here at Uplogix. Foremost, is why there aren’t more restaurants near our offices on Loop 360 in Austin, and secondly, why anyone would want to use the network to manage the network. Centralized management tools that employ SNMP and syslog do just that, relying on the network path to query the end devices. If the network goes down, all visibility is lost. And even when the network is up and working as designed, there are still bandwidth considerations that force engineers to limit the number of times they poll each device. Five minutes may not sound like a lot of time between queries, but in some cases, the Uplogix Local Manager can detect, alert, and fix an issue in less than five minutes, often before typical network management systems even notice there’s a problem.
This is possible thanks to 4K HDR UHD high-resolution monitoring.
R(eliable)S(table)-232(times better than TCP/IP)
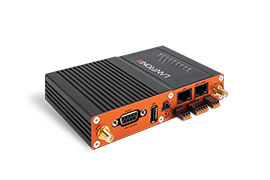
Instead of connecting to a managed device over the network, an Uplogix Local Manager attaches directly to the management console port, which allows communication even when the network is down, for example, if the device is stuck in ROMMON mode. Having this direct connection also means bandwidth considerations go right out the window; we can happily send one command after another to line con 0 without so much as a blip in the device’s CPU utilization. With the Local Manager sitting in the rack with the device, there’s not much that can break our line of communication except maybe a wild card employee with a pair of wire cutters (and we’ll detect that too).
Essentially, the Local Manager is a virtual employee who has pulled up a rolling chair next to your telco rack and connected their laptop to your network device. You could pull every network cable from your router or pull its flash card, and the Local Manager would still be able to monitor it.
Now we’re ready to do some real work.
Let’s Start with the Essentials
We’re often asked, “What kind of things can I monitor with the Uplogix Local Manager?” Thanks to our drivers and a rules engine that allows us to write in our own commands, the answer is pretty much anything. Before we get into that, let’s take a look at some of the basics you get just by turning on advanced drivers with a Cisco router.
After initializing a port, we will automatically schedule default monitors and jobs. These include:
- A chassis monitor to pull CPU and memory statistics
- A syslog monitor to pull device messages into the Local Manager
- A deviceinfo job to check IOS version and uptime
- Configuration backup jobs to monitor changes in the startup and running configuration files
- An OS backup job to monitor changes in the operating system
These monitors and jobs run at different intervals, but you can see them working by running terminal shadow from a configured port. Common output shows the Local Manager checking its privilege (show privilege), turning off paging (terminal length 0), and checking the CPU usage (show processes cpu | include cpu).
A Hidden (but Immediate) Benefit
In the grand scheme of things, it’s not what we’re monitoring that’s actually important—it’s that we’re monitoring at all. To be able to send commands and receive output, the router has to be in a good state. If it loses power and stops communicating, we’ll detect that within seconds, not because we are specifically looking for “loss of communication,” but because every monitor and job expects a response, and if it doesn’t get one, we throw an alarm and alert the authorities. If the router reboots and comes up in ROMMON mode, we’ll detect that because we’re looking for the hostname prompt every time we run a command, and if we don’t see it, or if it has reverted to the default Router, we know something is wrong.
Any monitor or job can lead to the detection of a problem, and just by having the defaults scheduled, you can rest assured we’re going to let you know when something goes wrong with the core functionality of the router.
Put Interfaces Under a Microscope
Router interfaces are not monitored individually by default, but turning on that functionality is as easy as running the config monitor interface command from the port.
[super@UplogixLM (port1/1)]# config monitor interface GigabitEthernet0/1
Validate scheduled monitor(interface, GigabitEthernet0/1)? (This will execute the job now.) (y/n): y
Job was scheduled 15: [Interval: 00:00:30 Mask: * * * * *] rulesMonitor interface GigabitEthernet0/1 30
Once configured, the Local Manager will now run a show interface command against the router on the prescribed interval:
AUS-CORE#show interface GigabitEthernet0/1
GigabitEthernet0/1 is up, line protocol is up (connected)
Hardware is Gigabit Ethernet, address is e804.62a8.cd81 (bia e804.62a8.cd81)
MTU 1500 bytes, BW 1000000 Kbit/sec, DLY 10 usec,
 reliability 255/255, txload 1/255, rxload 1/255
Encapsulation ARPA, loopback not set
Keepalive set (10 sec)
Full-duplex, 1000Mb/s, media type is 10/100/1000BaseTX
input flow-control is off, output flow-control is unsupported
ARP type: ARPA, ARP Timeout 04:00:00
Last input never, output 00:00:00, output hang never
Last clearing of ""show interface"" counters never
Input queue: 0/75/0/0 (size/max/drops/flushes); Total output drops: 0
Queueing strategy: fifo
Output queue: 0/40 (size/max)
5 minute input rate 0 bits/sec, 0 packets/sec
5 minute output rate 0 bits/sec, 0 packets/sec
 53 packets input, 4926 bytes, 0 no buffer
 Received 53 broadcasts (53 multicasts)
 0 runts, 0 giants, 0 throttles
 0 input errors, 0 CRC, 0 frame, 0 overrun, 0 ignored
 0 watchdog, 53 multicast, 0 pause input
 0 input packets with dribble condition detected
 3391364 packets output, 300885748 bytes, 0 underruns
 0 output errors, 0 collisions, 1 interface resets
 0 unknown protocol drops
 0 babbles, 0 late collision, 0 deferred
 0 lost carrier, 0 no carrier, 0 pause output
 0 output buffer failures, 0 output buffers swapped out
The output from the show interface command is then stored on the Local Manager. You can view the data with the show interface command on the port:
[super@UplogixLM (port1/1)]# show interface GigabitEthernet0/1
Displaying Interface Config
--------- --------- -----
Found 1 config entries for interface in the database.
Admin Status: up Arp Timeout: 04:00:00
Arp Type: ARPA Autonegotiation: N/A
Bandwidth: 1000000 Delay: 10
Description: N/A Encapsulation: ARPA
Full Duplex Mode: N/A Hardware: Gigabit Ethernet
Input Flow Control: false Ip Address: N/A
Keep Alive Set: true Loopback Set: false
Mac Address: e804.62a8.cd81 Media Type: 10/100/1000BaseTX
Mtu: 1500 Output Flow Control: N/A
Queueing Strategy: fifo Timestamp: 2021-07-22 08:34:16 CDT
-----
Displaying Interface Statistics
---------- --------- ----------
Found 1 statistical entries for interface in the database.
Boolean 1: N/A Boolean 2: N/A
Boolean 3: N/A Double 1: N/A
Double 2: N/A Double 3: N/A
Input Aborted Packets: 0 Input Alignment Errors: 0
Input Broadcast Packets: 53 Input Bytes: 4926
Input CRC Errors: 0 Input Dribbles: 0
Input Errors: 0 Input Frame Errors: 0
Input Frames: 0 Input Giants: 0
Input Ignored Packets: 0 Input Lack Of Resource Errors: 0
Input Late Collisions: 0 Input Load: 0.004
Input Multicast Packets: 53 Input Overrun Errors: 0
Input Packets: 53 Input Pause: 0
Input Queue Drops: 0 Input Queue Flushes: 0
Input Queue Max: 75 Input Queue Size: 0
Input Rate bits/second: 0 Input Rate packets/second: 0
Input Replenish Misses: 0 Input Restarts: 0
Input Runts: 0 Input Throttles: 0
Input Unicast Packets: 0 Input Watchdog: 0
Last Clearing Counters: N/A Last Input: N/A
Last Output: 00:00:00 Last Output Hang: N/A
Line Protocol Status: up Load: 0.000
Long 1: N/A Long 2: N/A
Long 3: N/A Looped: false
Operational Status: up Output Babbles: 0
Output Broadcast Packets: 0 Output Buffer Failures: 0
Output Buffers Swapped Out: 0 Output Bytes: 300889499
Output Collisions: 0 Output Deferred: 0
Output Errors: 0 Output Excessive Collisions: 0
Output Frames: 0 Output Interface Resets: 1
Output Late Collisions: 0 Output Load: 0.004
Output Lost Carrier: 0 Output Multicast Packets: 0
Output Multiple Collisions: 0 Output No Carrier: 0
Output Packets: 3391407 Output Pause: 0
Output Queue Drops: 0 Output Queue Max: 40
Output Queue Size: 0 Output Queue Threshold: 0
Output Rate bits/second: 0 Output Rate packets/second: 0
Output Single Collisions: 0 Output Underrun Errors: 0
Output Unicast Packets: 0 Reliability: 1.000
Timestamp: 2021-07-22 08:35:16 CDT
-------
Displaying Alarms for Interface
---------- ------ --- ---------
Found 0 alarms for interface in the database.
With all of this data now stored on the Local Manager, we can use our Rules Engine to examine it, evaluate it, and take action if necessary. Have an old router that needs to be reloaded every time its FastEthernet0/0 takes too many errors? We can do that. Need an alert sent when Output Rates Bits per Second exceeds a certain threshold for five minutes? We can do that too.
Or what if someone simply unplugs the Ethernet cable?
[super@UplogixLM (port1/1)]# show alarms
CDT Elapsed Device Context Message
----- ------- -------- ------------------ ------------------------
08:41 0:02 AUS-CORE GigabitEthernet0/1 Protocol state down.
08:41 0:02 AUS-CORE GigabitEthernet0/1 Operational state down.
The above alarms are generated from default rules. You can write your own (and we can help!) to evaluate pretty much any of the data we collect with the monitor.
Let’s Get Arbitrary
The more you explore our Rules Engine, the more you discover just how powerful it can be. With our execute action, we can send arbitrary text sequences (commands, arguments, carriage returns) to your router.
These commands can be simple in the vein of something like show version, or they can get really advanced:
action execute -raw -pattern ""#"" -command ""ennn""
action execute -command ""show info"" -pattern ""Status: (DDDDDDD)"" -setValue monitor ShowInfo $1
action execute -raw -pattern ""#"" -command ""ennn""
action execute -command ""sh interface lan0_0 brief"" -pattern ""Link: (DD)"" -setValue monitor ShowIntLan $1
action execute -command ""sh interface inpath0_0 brief"" -pattern ""Up: (DD)"" -setValue monitor ShowInpath $1
action execute -command ""sh interface wan0_0 brief"" -pattern ""Link: (DD)"" -setValue monitor ShowIntWan $1
action execute -raw -pattern ""#"" -command ""term leng 0nn""
action execute -command ""sh stat ala"" -pattern ""Alarm linkstate: (DDDDD)"" -setValue monitor LinkState $1
action execute -command ""sh stat ala"" -pattern ""Alarm bypass: (DDDDD)"" -setValue monitor ByPassState $1
This type of functionality is often used with native and enhanced drivers to build automation for devices for which we don’t have an advanced driver. However, that doesn’t mean you can’t use them with Cisco or Juniper or any of our full-service drivers. You know your network and devices best; if there’s something we haven’t thought of, we’ll help you add it in!
Consistency is Key
Whereas other network management solutions are relying on the network and only querying at a respectful five-minute interval, the Uplogix Local Manager is in constant contact with your devices. By virtue of checking the CPU usage, we also check the device’s ability to simply respond to a query. We monitor constantly, regardless of the network state. When the network is down, we establish an out-of-band path back to your HQ so you can still have access (read: visibility) to the data we are diligently collecting.
But wait, there’s more!
Once the Local Manager has reconnected to the network via cellular or satellite modem, it can forward data to your other centralized, network-based management solutions, giving them visibility despite the break in the network.
We’re not greedy when it comes to keeping tabs on your network, and we happily integrate with your existing management solutions. SolarWinds, Splunk, Earl’s custom syslog server—we can keep them all fed during a network outage, all thanks to our consistent, network-independent monitoring.
Ready to see it in action? Drop me a note at [email protected] and we’ll set up a demo!
“
