Is Your Website Working Hard or Hardly Working?
Looking back, it’s funny to think about how much effort we used to put into keeping the internal network up back in the day, when all of our customer interaction was funneling through a single Linux server running Apache and MySQL. Of course, we hooked that server up to an Lantronix Local Manager to allow us to monitor services and memory and all the other stats that indicated whether Apache was serving pages consistently and efficiently. But was that enough? Well, I wouldn’t be writing this blog post if the answer were no.
You’ve got SLAs? We’ve got SLV.
We introduced Service Level Verification (SLV) years ago when I was just a tiny little Support Specialist. The goal was to go beyond the simple question of is Apache running and ask instead how well is Apache performing? We can answer this question by simulating an HTTP request, gathering statistics on the response, and taking action if any of those statistics meet certain conditions. The tests run directly from the Local Manager using its primary in-band connection, but it’s not limited to a single LM. You could test your website from any of your datacenters across the country and get a sense of how well it performs regionally.
Let’s take a look at how it’s done.
Note: SLV is an add-on feature that requires a separate license . If you would like to evaluate SLV with a temporary test license, please contact Lantronix Support.
Choose a Target
Since SLV is licensed per-LM, the test must be created on the individual Local Manager itself, but you can still use the Control Center’s web interface to do it. Head over to the Local Manager’s Summary page and click SLV Tests under Automation.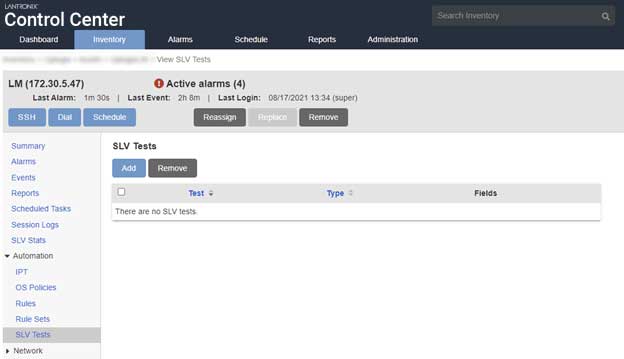
Click Add to create a new test. There are three types of SLV tests (HTTP, IPT, and TCP), but we’re going to focus on HTTP. Give your test a name and a target. Specify HTTP vs HTTPS in the URL argument. Click Save.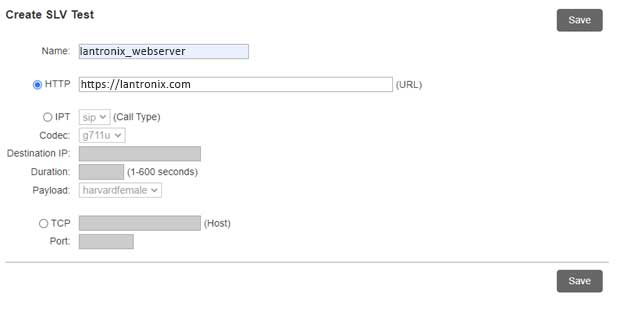
After the next heartbeat, the test should be visible on the Local Manager’s CLI.
Schedule the Test
You can start collecting data by running the config monitor slv command on the Local Manager.
[dverastiqui@LantronixLM]# config monitor slv Lantronix_webserver :60
Validate scheduled monitor(slv)? (This will execute the job now.) (y/n): y
Job was scheduled 18: [Interval: 00:00:60 Mask: * * * * *] rulesMonitor slv Lantronix_webserver 60
The above example will make an HTTP request to the specified target every 60 seconds.
Behold My Data
From the CLI, you can use the show slv stats command to view the data collected by the test.
[dverastiqui@LantronixLM]# show slv stats Lantronix_webserver
CDT       Test           IP Address     Connect     1st Byte     Last Byte     # Bytes     HTTP Response     Message
-----     ----------     -----------     -------     --------     ---------     -------     -------------     -------
09:10     Lantronix_we     45.56.74.20     676         678         685           111362     200 OK
09:10     Lantronix_we     45.56.74.20     658         660         667           111352     200 OK
09:09     Lantronix_we     45.56.74.20     703         705         709           111362     200 OK

If we’re just looking for uptime, we might key in on the HTTP response of 200. If we’re more performance-minded, we might look at the time to connect and how long it took to get the first byte versus the last byte. In the above example, we can see that a single call to our website produces 111K of traffic.
Consider a different server:
[dverastiqui@LantronixLM]# show slv stats verastiqui_webserver
CDT       Test           IP Address       Connect     1st Byte     Last Byte     # Bytes     HTTP Response     Message
-----     ----------   -------------     -------     --------     ---------     -------     -------------     -------
09:20     verastiqui     10.10.10.144     41         41           41           7018       200 OK
09:19     verastiqui     10.10.10.144     36        37           37           7015       200 OK
09:18     verastiqui     10.10.10.144     53         54           54           7026       200 OK

Notice it has a smaller root page at only 7K, so its response times are much lower. That’s an example of different servers, but you could also test the same server from multiple locations and compare the results. Maybe the response times are fine in Chicago where the server is located but not as great in Zanzibar where you got assigned because you kept stealing coworkers’ lunches from the break room.
Perhaps a Graph Would Help?
One of the nice things about having all this data is that we can then upload it to the Control Center during the archive process (by default, once every hour) and view it in graphical form. We’ll even create some nice charts to help visualize the data.
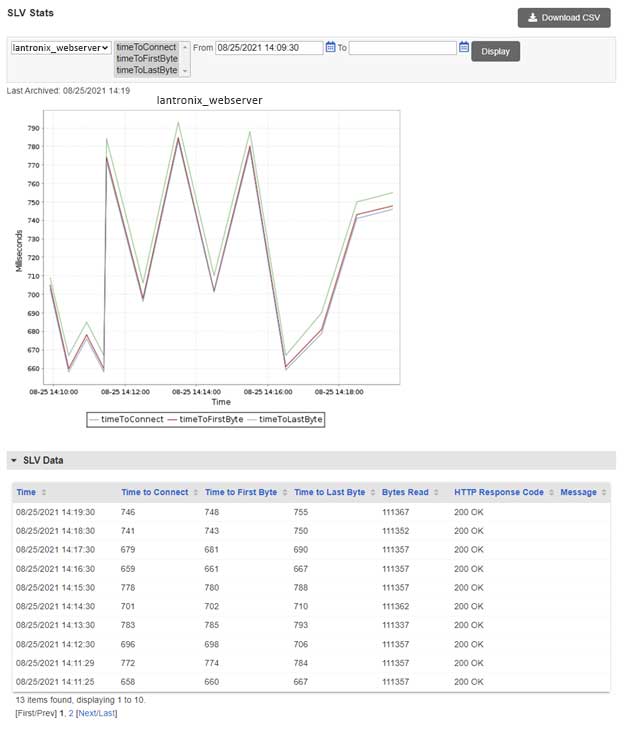
Are you an Excel guru? We make it easy to download all the data in CSV format so you can create pivot tables and floating point synergy graphs to your heart’s content.
Be In the Know
With SLV and the Lantronix Rules Engine, getting notified when the webserver is slowing down is almost too easy.
[dverastiqui@LantronixLM]# show rule webserverSlow
rule webserverSlow
action alarm GENERIC -a "Webserver Time to Connect TOO SLOW (above 50 ms)"
conditions
slv.timeToConnect max 50
exit
exit

[dverastiqui@LantronixLM]# config mon slv Lantronix_webserver webserverSlow :60
Validate scheduled monitor(slv)? (This will execute the job now.) (y/n): y
Cancelling previous monitor for 'slv Lantronix_webserver'
Job was scheduled 21: [Interval: 00:01:00 Mask: * * * * *] rulesMonitor slv Lantronix_webserver webserverSlow 60

[dverastiqui@LantronixLM]# show alarm
CDT     Elapsed   Device    Context               Message
-----   -------   --------   ------------------   --------------------------------------------------------------------------
09:31   0:03                  Lantronix_webserver     Webserver Time to Connect TOO SLOW (above 50 ms)
If you’re subscribed to the system resource of that Local Manager, you’ll get an email alert. If you log into the Control Center, you’ll see it listed with other alarms.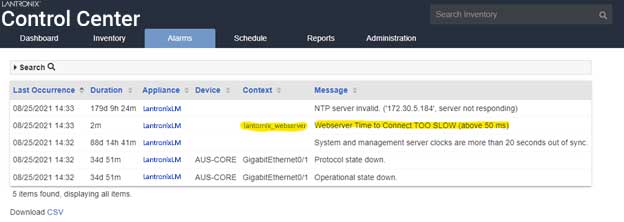
A More Controlled Test
A lot of web pages are dynamic, so their file sizes may fluctuate with each request. If you’re trying to get consistent results, you may want to specify a file with a known size instead of the web root. We could ask the question how long does it take to transfer 5MB? Use one of the many online tools available to generate a 5MB file, place it somewhere on your website, and create a test.
Schedule it, let it run and let the Local Manager archive, and then you’ll have yourself a nice graph showing transfer speeds over time.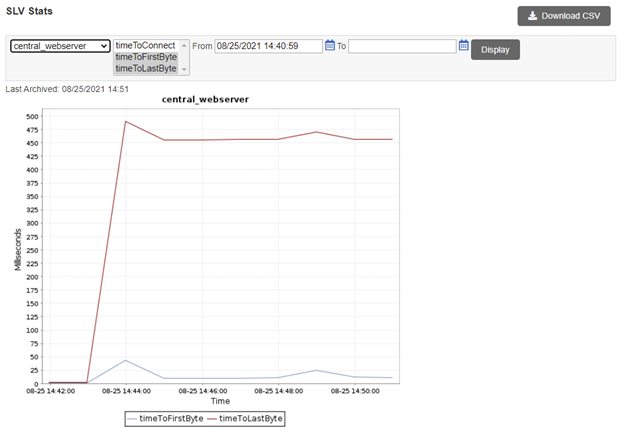
Now What?
Once you’re feeding data into the Rules Engine, the possibility for automation really opens up. The rules you create to watch the HTTP data can set variables that are shared system-wide, allowing a monitor on a different port to view them. You could have a monitor on Port 1/3 (where your Linux server is) look for a variable to change from false to true. When it does, the monitor could send the command service apache restart to the server’s CLI. Or shutdown -r now. Or service minecraft_server stop. The possibilities are endless.
What’s great about SLV is that it works inside your network on servers that would otherwise be inaccessible to services like Pingdom and Jetpack. With the TCP SLV test, you can monitor other network services like SCP, FTP, SMB, NTP, and all the other initialisms. And if you’ve got SIP phones in your network, you can use SLV to simulate VoIP calls.
Ready to try it out? Drop us a note at Lantronix Support if you’d like some assistance.
